Social Media ROI Tracking: How AI-Powered Analytics Tools Change the Game
Stop tracking vanity metrics. Learn how AI-powered analytics tools shift social media ROI from descriptive reporting to predictive, real-time revenue growth.
Data & Studies
When to post on Facebook, Instagram, LinkedIn, X, TikTok, YouTube, Pinterest and Threads in 2026, per Sprout, Buffer, Later and Hootsuite, plus a test plan.
For most networks, 2026 data points to weekdays, especially Tuesday through Thursday, from late morning to mid-afternoon in your audience's local time. Facebook, Instagram, LinkedIn, X and Pinterest follow that pattern. TikTok, YouTube and Bluesky are the exceptions, where some studies find weekends doing well. The large studies disagree on exact hours, so use the times below as starting points and confirm them with your own analytics.
This guide summarizes the main public studies network by network, explains why they conflict, and gives you a test plan to find your own best times.
Each study below comes from a scheduling or social media management vendor. Each one measures something slightly different, which explains most of the disagreements later in this guide.
| Study | Published | Sample | Time zone handling | Main metric |
|---|---|---|---|---|
| Sprout Social, best times to post | March 31, 2026 | Nearly 2 billion engagements across about 307,000 profiles, Nov 27, 2025 to Feb 27, 2026 | Local time for each profile | Total interactions per post |
| Buffer, best time to post | March 25, 2026 | Over 52 million posts across seven networks | Adjusted to local time | Median engagement (reach for Instagram's top slot, views for TikTok) |
| Later, best time to post on Instagram | April 21, 2026 | Over 6 million Instagram feed posts from January to October 2024 | Normalized to the audience's local time | Engagement rate |
| Hootsuite, best time to post | November 19, 2025 | Over 1 million posts, with research partner Critical Truth | Normalized across 118 countries | Not broken out per network |
Two quick notes. Sprout's data window covers the late-November to February holiday season. Later's Instagram figures come from 2024 data, even though the article was updated in 2026.
Starting point: test a weekday morning (9 a.m.) against a weekday lunchtime to early afternoon slot, Tuesday through Thursday.
Instagram has the widest spread of findings of any network:
Later's early-morning result probably reflects its metric. Engagement rate can favor posts that face less competition when people first open the app. Sprout counts total interactions, which favors busy hours. For a deeper breakdown, see our best time to post on Instagram guide.
Starting point: test one early-morning slot (5 to 9 a.m.) against one afternoon slot (1 to 4 p.m.) on weekdays.
Starting point: the two larger datasets agree on midweek afternoons. Test 11 a.m. to 1 p.m. against 3 to 5 p.m., Tuesday through Thursday.
Starting point: weekday mornings (9 to 11 a.m.) are backed by two of the three studies. Test them against an early-afternoon slot.
TikTok is where the studies disagree most sharply about weekends:
Part of the gap likely comes from the metric. Buffer measured views, while Sprout counted interactions, and the two don't always peak together.
Starting point: test a weekday afternoon slot against a weekend morning slot. TikTok is the network where your own data will most likely beat any average.
Sprout Social's 2026 report does not include YouTube timing data and points readers to YouTube Studio instead. Buffer is the main public source:
Buffer's own summary is not fully consistent. Its quick guide for long-form suggests 6 to 10 p.m. (Sunday to Tuesday), while the body text emphasizes mornings. YouTube is also the best example of a network where your own data is easy to get (see the test plan below).
Starting point: for long-form, test a weekend morning against a weekday evening. For Shorts, test late afternoon on Friday and Saturday.
Starting point: weekday late mornings, 10 a.m. to 1 p.m.
Starting point: weekday mornings, 7 to 10 a.m., Tuesday through Thursday.
Buffer's Bluesky study of over 3 million posts, published August 2026, is the most detailed public dataset. It found Saturday was the best day, with an average engagement rate of 6.17%. The best single time was Saturday at 5 p.m., at 6.89%. Thursday was the weakest day at 3.44%, and weekday late mornings to midday (about 10 a.m. to 1 p.m.) were quiet. This is one vendor's data on a young network, so treat it as a hypothesis to test.
We could not find a large-scale public study of posting times on Mastodon. What we do know: Mastodon shows the posts of people you follow in chronological order, with no algorithmic ranking. That means a post is most visible when your followers are actually online, so timing probably matters more here than on algorithmic feeds. Check when replies and boosts arrive on your own posts and build from there.
We found no credible public study of the best time to publish Google Business Profile posts. These posts are seen by people searching for your business, not by followers scrolling a feed. Publishing ahead of your busy periods (for example, before a weekend offer starts) is a better rule than any hour of the day.
If Sprout says Instagram peaks in the afternoon and Later says 5 a.m., they are not both wrong. They are measuring different things.
The useful takeaway is the overlap. Weekdays outperform weekends on most networks, and Sunday was the weakest day overall in Sprout's data. Beyond that, your audience decides.
Your native analytics show when your followers are online, which beats any average. Here's a simple plan.
Combine the activity chart with the study ranges above. For example, on LinkedIn you might test Tuesday 11 a.m., Wednesday 4 p.m. and Thursday 8 a.m. Make the slots genuinely different. Testing 1 p.m. against 2 p.m. won't tell you much.
Choose one primary metric per network and stick with it:
| Network | Suggested primary metric |
|---|---|
| Instagram, Facebook, Threads | Reach or views in the first 24 hours, plus saves/shares |
| Impressions and comments | |
| X, Bluesky, Mastodon | Replies and reposts/boosts |
| TikTok, YouTube Shorts | Views and average watch time |
| YouTube long-form | Views and watch time in the first 48 hours |
| Outbound clicks and saves |
Compare the median per slot, not the average. One viral post can distort an average.
Keep the winning slot as your default and keep one slot for ongoing experiments. Audiences shift, especially after a platform changes its feed. Re-run the test every quarter or after a big change in your audience, such as a new market or a campaign that brings in many new followers.
Running this by hand across several networks takes time. Social9's analytics dashboard tracks how posts perform by posting time across networks. Social9's automation can schedule each post for an AI-recommended time based on your audience and past engagement. For the wider scheduling workflow, see our complete guide to social media scheduling and the content scheduling strategy guide. More research-based posts are in the data hub.
There isn't one. Sprout Social's 2026 data points to Tuesday and Wednesday, 11 a.m. to 6 p.m. local time, as the best overall window. Buffer and Hootsuite name different hours. A midweek late-morning to afternoon slot is a reasonable default until your own data says otherwise.
On Facebook, LinkedIn, X and Pinterest, most 2026 data shows weekends underperform. TikTok, YouTube and Bluesky are exceptions: Buffer's data found Saturday was TikTok's best day and Sunday mornings strong for long-form YouTube.
Use your audience's time zone, not yours. The major studies report local time for the audience. If your followers are split across regions, schedule for the largest group, or post at different times for each.
Four to six weeks with at least a few posts per slot is a practical minimum. Shorter tests are easily skewed by one strong or weak post.
No. Timing affects early distribution, but every study here frames its numbers as a starting point. A weak post at the perfect time still underperforms a strong post at an average time.
Insights show when your own followers are online, while the studies average hundreds of thousands of accounts. When they disagree, trust your Insights and test both.

Stop tracking vanity metrics. Learn how AI-powered analytics tools shift social media ROI from descriptive reporting to predictive, real-time revenue growth.

Stop manual auditing. Learn how to use AI-powered competitor analysis to decode audience sentiment, identify true digital rivals, and predict market shifts.
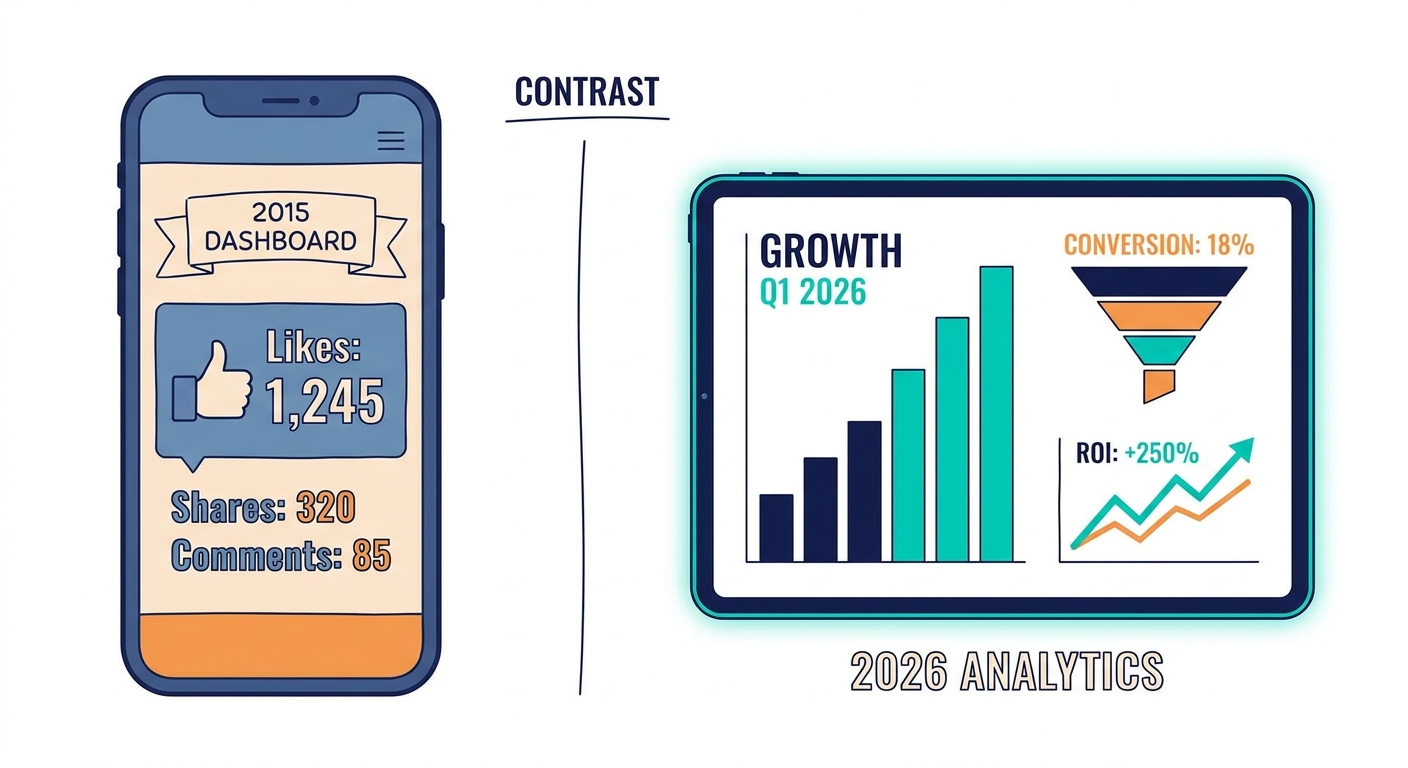
Stop tracking vanity metrics. Learn when to upgrade from free native analytics to paid tools to drive actual revenue and ROI for your business in 2026.
Social9 schedules your posts on 11 networks, and Autopilot can draft them in your brand voice for you to approve. Start on the free plan.
We use strictly necessary cookies to run this site. With your permission, we also use analytics cookies to understand how the site is used. We never use advertising cookies. See our Cookie Policy.