Best times to post on each social network in 2026
When to post on Facebook, Instagram, LinkedIn, X, TikTok, YouTube, Pinterest and Threads in 2026, per Sprout, Buffer, Later and Hootsuite, plus a test plan.
Data & Studies
Stop hoarding data. Learn how to create impactful monthly social media reports that prove business ROI and resonate with the C-suite in 2026. Michael JohnsonAnalytics & Performance SpecialistPublished 6 min read
If your monthly social media report is just a glorified screenshot collection of follower counts and vanity likes, you aren't reporting. You’re hoarding data. You’re essentially a glorified digital librarian for numbers that don’t actually matter.
In 2026, the mandate for social media managers has shifted. It’s no longer about "being visible." It’s about "being valuable." Your reports need to act as a bridge between creative output and raw business intelligence. You have to prove to stakeholders that your social activity is actually moving the needle on revenue, lead generation, and brand health. If you can’t look a stakeholder in the eye and explain the "so what" behind a 5% increase in impressions, you’re effectively invisible to the C-suite.
The era of the "data dump" is dead. Executives don’t have the time—or the patience—to wade through fifty pages of platform-specific graphs that lack context. They don't care about your reach if it doesn't translate to results.
A modern reporting strategy is narrative-first. Data should only exist to support a story of business impact. Before you pull a single number, revisit your overarching social media strategy. Is your reporting tethered to actual business goals? If your strategy is about brand awareness, your report should highlight reach and share-of-voice. If it’s about demand generation, lead with attribution and conversion. Without this alignment, you’re just creating expensive noise.
Moving beyond vanity metrics requires a ruthless look at your KPIs through the lens of the marketing funnel. If you’re still leading with "follower growth," you’re focusing on the scoreboard rather than the game.
Awareness: This is your top-of-funnel health. But look deeper. Beyond simple reach and impressions, you need to be tracking "Social SEO" visibility. Are your posts actually showing up in search results on TikTok or LinkedIn when users look for your industry keywords? That is the new baseline for discoverability.
Engagement: Stop counting likes. Seriously. Likes are the lowest form of currency on the web. Focus on "high-intent" engagement—specifically saves and shares. These metrics prove your content provided enough utility for a user to bookmark it for later or vouch for it by sharing it with their own network. For a deeper dive into how to benchmark these against industry standards, consult this comprehensive guide on KPI definitions.
Conversion: This is where the CFO finally starts paying attention. You must track Click-Through Rate (CTR) from social channels to your website, lead generation volume, and, where possible, attributable sales. If you can’t draw a straight line from a social campaign to a CRM entry or a checkout event, you are missing the most critical piece of the puzzle.
The greatest failure in social media reporting is the inability to translate technical jargon into business outcomes. Your stakeholders don't care that your "Engagement Rate increased by 2%." They care about what that means for the business.
When you present data, map your metrics to business outcomes. A high "Sentiment Score" isn't just a social metric; it’s a leading indicator of "Brand Health" and a predictor of "Churn Risk." If you see negative sentiment spiking, you aren't just seeing a bad comment section—you are seeing a potential hit to customer retention.
The Executive Translation Cheat Sheet
| Social Metric | Business Outcome |
|---|---|
| Sentiment Score | Brand Health / Churn Risk |
| Share of Voice | Market Penetration |
| Cost Per Click (CPC) | Customer Acquisition Cost (CAC) |
| High-Intent Engagement | Customer Lifetime Value (CLV) |
| Response Time | Customer Support Overhead |
By shifting your language from "clicks" to "acquisition costs," you stop being a "social media person" and start being a business partner.
Your report should respect the reader's time. Start with the narrative, move to the outcomes, and relegate the granular data to the back.
graph TD
    A[Executive Summary: The Narrative] --> B[Key Business Outcomes]
    B --> C[Platform Highlights: The Data]
    C --> D[Appendix: Raw Data]

    style A fill:#f9f9f9,stroke:#333,stroke-width:2px
    style B fill:#e1f5fe,stroke:#0277bd,stroke-width:2px
    style C fill:#fff3e0,stroke:#ef6c00,stroke-width:2px
    style D fill:#f5f5f5,stroke:#9e9e9e,stroke-width:2px
The Executive Summary should follow the "Problem -> Action -> Result -> Future Strategy" framework. State the goal, what you did, the numerical result, and what you’re going to do differently next month. If the data is the "what," the narrative is the "why." If you had a post go viral, tell the story of why that format resonated and how you plan to replicate that success.
In 2026, social platforms are effectively search engines. Users are bypassing traditional Google searches in favor of finding recommendations directly on Instagram, TikTok, and Reddit. If your reporting doesn't account for discoverability, you’re missing half the picture.
You need to track keyword rankings within social platforms. Are your videos showing up when users search for your core service offerings? Are your captions optimized for the search algorithms of each platform? For teams looking to reach a higher level of data maturity, these advanced reporting frameworks provide a roadmap for quantifying search-based visibility alongside traditional discovery.
If you are still manually copying and pasting data from platform native tools into a spreadsheet, you are wasting your most valuable resource: your time. Manual reporting is prone to error. More importantly, it keeps you from acting in real-time.
You should be utilizing automated dashboards that consolidate cross-platform performance into a single, high-contrast view. A well-constructed dashboard should be organized into three distinct columns:
By centralizing this data, you can spot trends as they happen rather than waiting for the end-of-month autopsy. If you are currently shopping for a solution to handle this integration, check out our guide on choosing the right tools for your marketing dashboard.
You don't need a 50-slide presentation to prove your worth. In fact, the most effective reports are often the briefest. Focus on the "Top 3 Metrics" that dictate your next month’s strategy. If your primary goal is lead generation, your report should lead with:
Establish a repeatable loop: Data Collection (automated), Insight Synthesis (your analysis), and Strategy Adjustment (your plan). Rinse and repeat. For a comprehensive audit of your current success metrics, use this social media audit checklist to ensure you aren't leaving any critical performance indicators on the table.
A report is not a final document; it is a feedback loop. Every single month, your data should inform your next creative decision. If a specific video style performed exceptionally well, that isn't just a data point—it's a production mandate for the next month.
Treat your reporting as a living, breathing component of your strategy. Growth doesn't come from reporting on what happened; it comes from using what happened to guarantee a better result next time. Standardize your process, automate your data collection, and always keep the focus on the business outcome.
Monthly is the gold standard for high-level performance alignment, but consider weekly "pulse checks" for active, high-budget campaigns to allow for tactical pivots.
There is no single "silver bullet." However, prioritization has shifted toward Conversion Rate and Sentiment Analysis, as these provide the clearest link to revenue and brand perception.
Position engagement as "audience resonance." Explain it as the degree to which your content is valuable enough to earn a user's time, attention, and trust, which directly correlates to lower customer acquisition costs.
Yes, but keep it segmented. Use a "Big Picture" executive summary that aggregates all platforms, then provide a platform-specific section for granular data to keep the report digestible for leadership.
When to post on Facebook, Instagram, LinkedIn, X, TikTok, YouTube, Pinterest and Threads in 2026, per Sprout, Buffer, Later and Hootsuite, plus a test plan.
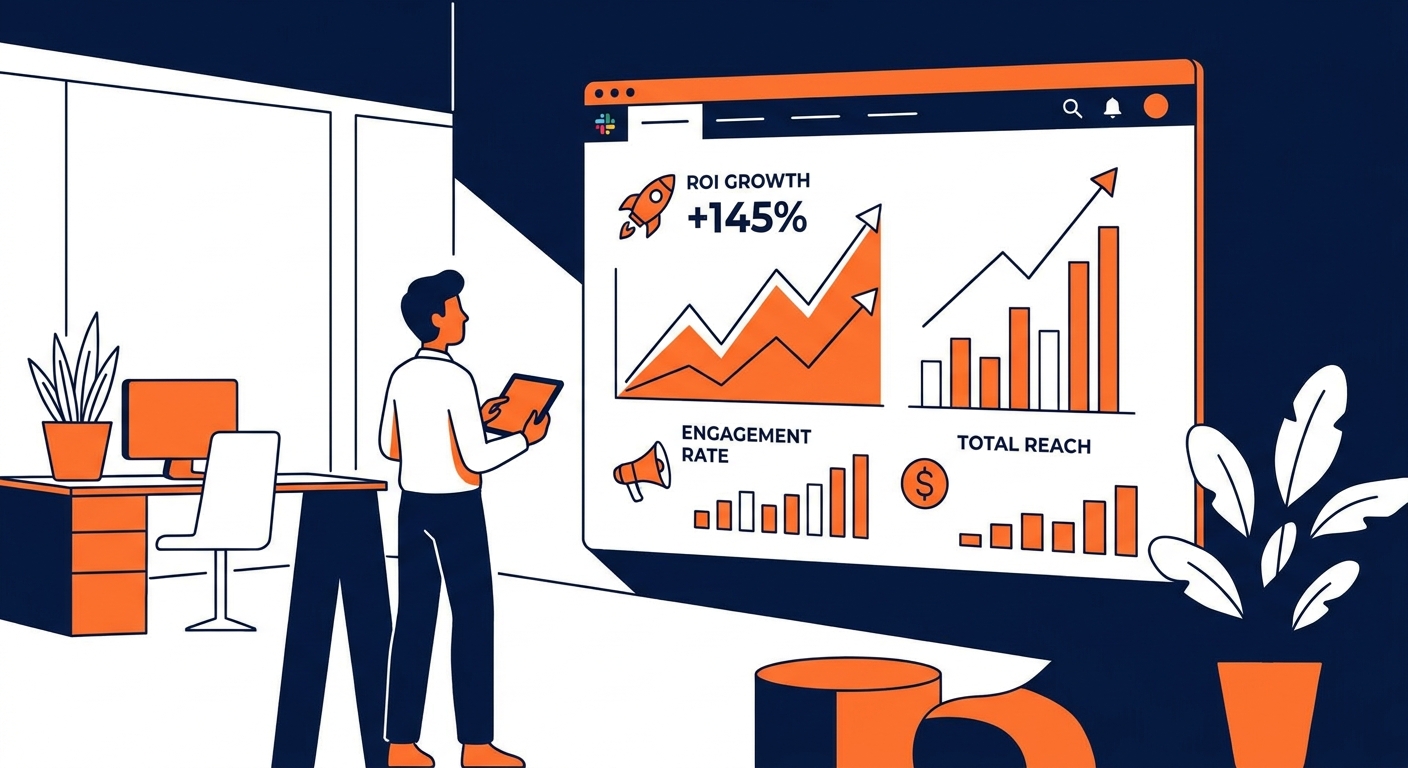
Stop tracking vanity metrics. Learn how to use social media reporting tools to prove ROI, bridge the dark funnel, and align social activity with business goals.

Stop chasing vanity metrics. Learn how to track social media ROI, bridge the attribution gap, and leverage AI for predictive growth in 2026.
Social9 schedules your posts on 11 networks, and Autopilot can draft them in your brand voice for you to approve. Start on the free plan.
We use strictly necessary cookies to run this site. With your permission, we also use analytics cookies to understand how the site is used. We never use advertising cookies. See our Cookie Policy.