Must to know Social Media Statistics and Facts of 2020 (Infographic)

Since 2004, social media has been growing exponentially and it hasn’t reached the peak of its popularity yet.
There’s no denying that social media platforms are now a major source of data, news and information. Social media platforms are unique in the way they interact with customers. Not only do they provide a platform for users to communicate beyond local and social boundaries, but they also offer countless possibilities to share user-generated content, like photos and videos.
With popular social media platforms growing in terms of size, each platform has a unique audience. If you cater your content toward the audience of the social media platform, you’ll be successful.
We come across all sorts of interesting stats about social media platforms and users, so we’ve collated the best of them in this bumper facts list. And it comes as a great fact sheet to give context to your social media marketing efforts. This article presents key social media statistics for 2020 and 2021 to help businesses understand the landscape and inform their marketing strategies.
We thought it would be a great idea to share the most important social media statistics to keep in mind, focusing on data from 2020 and looking ahead to 2021. Staying on top of the latest social media statistics will help enhance your marketing strategy and plan the interactions of your business with social media.
Let’s take a look at the top social media statistics for 2020, and how they can help shape your next year ahead.
Social Media Marketing Statistics/Data 2020
- Nearly 50% of the world's population uses social media. That's over 3 billion users worldwide. (Data from early 2021 reports)
- In 2019, 90.4% of Millennials, 77.5% of Generation X, and 48.2% of Baby Boomers were active social media users. 'Active' here generally refers to users who engage with social media platforms on a regular basis, though the specific definition can vary by source.
- 54% of social browsers use social media to research products.
- Each person spends an average of 2 hours and 22 minutes on social networks and messaging. (Based on a 2018 report)
- 321 million new people joined social media in 2019, which brought the total from 3.48 billion to 3.8 billion social media users (an increase of 9%) in 2020.
- Millennials are logged on to social media for an average of two hours and 38 minutes daily while Gen Z logs on for two hours and 55 minutes. (Based on a 2019 article)
Facebook Statistics
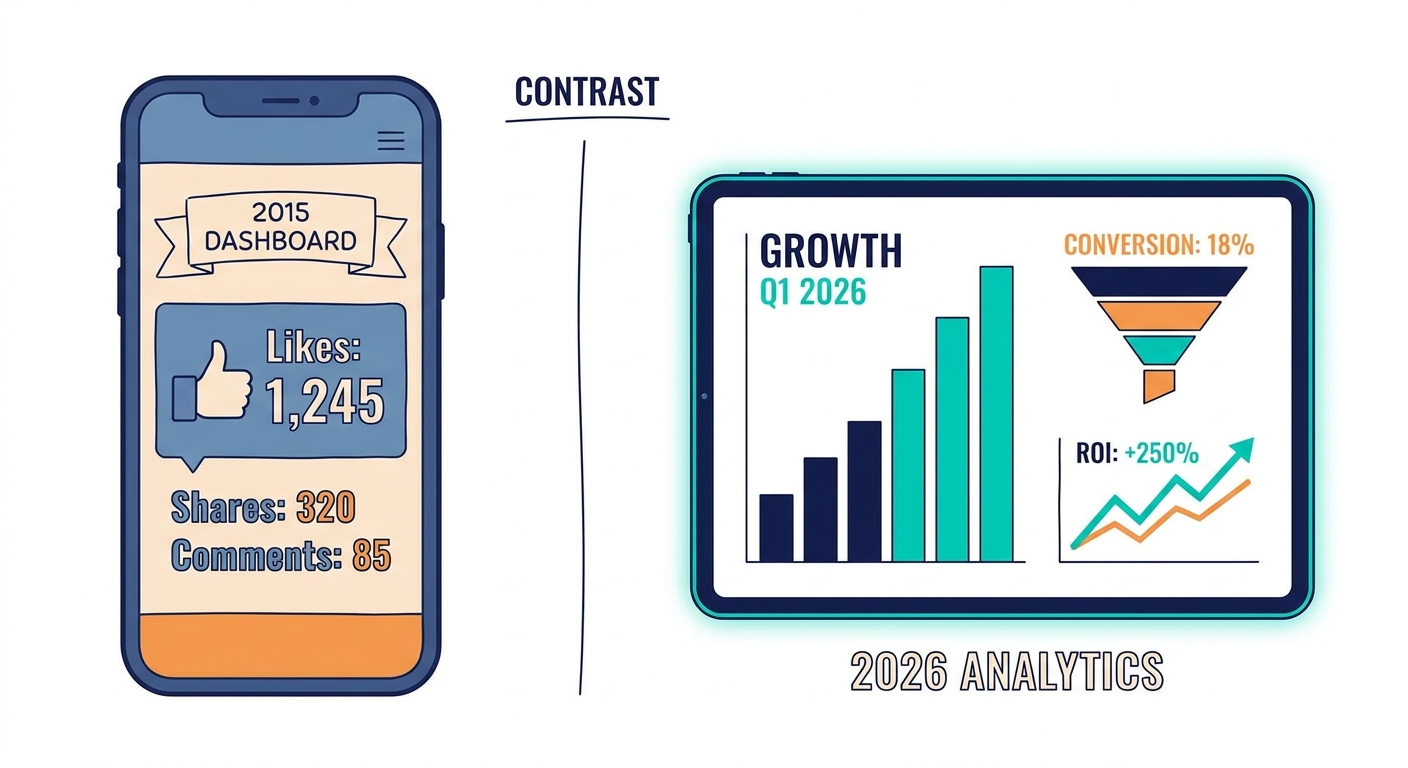
- Facebook usage among teens is dropping gradually according to the latest social media statistics. While 71% of teens claimed to use the platform in 2015, the number has now dropped to 51%. (Data from 2018)
- 68% of Americans use Facebook. (Data from 2018)
- 74% of Facebook users check it daily. (Data from 2018)
- Most people access Facebook around eight times each day.
- 96% of Facebook users access it on mobile.
- If your Facebook ads contain images, then they will be between 75% and 90% more effective. 'Effectiveness' in this context can refer to various metrics like click-through rates or engagement, as specified by the source.
- 93% of social media advertisers use Facebook ads on a regular basis.
- At least 3% of Facebook profiles are fake.
- The best time to post on Facebook is weekdays between 10 a.m. and 3 p.m. Wednesday is the best day to post while Sundays show the least traffic.
- .6% of marketers use Facebook video ads. This statistic might represent a very specific segment of marketers or campaign types.
- Facebook Stories has 500 million daily viewers.
- With 36% of viewers watching political Story content, politics is the top-Facebook Stories topic.
- Video promotions are equally as important as photo promotions. This is an observation based on the provided source, highlighting the comparable impact of video and photo content.
- 81% of businesses prefer video marketing on Facebook.
Twitter Statistics
- Twitter has more than 330 million monthly active users.
- In Q3 of 2019, Twitter had more than 145 million monetizable daily active users -- a 17% YoY growth.
- Twitter's 2019 Q3 revenue was $824 million, or 9% higher than Q3 in 2018.
- 22% of adults in the U.S. use Twitter, down from 24% in 2018.
- Link clicks account for 92% of all user interaction with tweets. 'User interaction' here primarily refers to actions taken on the tweet itself, with link clicks being the most common.
- 83% of the people who sent a Tweet to a company and received a response, felt better about the company and were more likely to do business with them.
- Only 3% of Tweets about customer service issues call out the company's username with the @ symbol. This suggests that many customers may not be directly engaging with companies on Twitter for customer service, potentially leading to missed opportunities for resolution and brand engagement.
- People are 31% more likely to recall what they saw on Twitter vs. general online browsing.
- 53% of users say they bought a product they first saw on Twitter.
- Twitter ads are 11% more effective than TV ads during live events.
- The best times to post on Twitter are Wednesdays at 9am and Fridays at 9am. The best days to post are Tuesday and Wednesday, while Saturday sees the least engagement.
Instagram Statistics
- As of late 2019, Instagram has 1 billion monthly active users, and 500 million of them use it daily.
- Instagram continues to attract a younger audience with 72% of teens saying that they use the platform.
- 64% of Instagram users are under the age of 34.
- Ad spending on Instagram is 23% higher than on Facebook according to an internal analysis by Merkle. (Timeframe of this analysis is not specified in the original text.)
- Videos get 21.2% more interactions compared to images and 18.6% more interactions compared to carousels. 'Interactions' here refers to engagement metrics like likes, comments, shares, and saves.
- 71% of US businesses use Instagram. It surpassed Twitter in business users in 2017.
- The best times to post on Instagram are Wednesday at 11am and Friday from 10-11am. Wednesday is the overall best day to post while Sunday sees the least amount of engagement.
- Between 2016 and 2020, eMarketer estimates Instagram added 26.9 million users -- almost double the incremental users expected for Twitter, and far more than any other social platform tracked. (Incremental user numbers for Twitter and other platforms are not provided for direct comparison.)
- In 2019, an estimated 25% of Facebook's total ad revenue came from Instagram. By the end of 2020, Instagram's share of that revenue will grow to 30% globally.
LinkedIn Statistics
- LinkedIn has more than 690 million active users.
- In Q1 of 2020, LinkedIn sessions increased 22 percent year-over-year. A 'session' typically refers to a period of user activity on the platform.
- In Q2 of 2020, LinkedIn revenue increased 21 percent year-over-year
- In 2019, LinkedIn made more than 6.8 billion in revenue.
- Marketing Solutions is LinkedIn’s fastest-growing segment. It grew 44 percent year-over-year in Q1.
- LinkedIn received 30 billion sessions from its members in 2019. This was a year-over-year increase of 27 percent.
- In 2019, LinkedIn was voted the most trusted network.
- 80% of social media B2B leads come from LinkedIn. This statistic is a broad claim and may vary across different industries and types of B2B leads.
- Over 46% of all social media traffic to company websites comes from LinkedIn.
- The best times to post on LinkedIn are Wednesdays from 9-10 a.m. and 12 p.m. The best day for posting is Wednesday and the day with the least engagement is Sunday.
YouTube Statistics
- YouTube is the second-largest search engine globally.
- YouTube is the preferred form of social media marketing worldwide. 83% of all consumers prefer it. This preference is in relation to discovering new products and engaging with marketing content.
- 54% of all people want marketers to put out more video content, and this is an excellent place to begin.
- Most of YouTube’s user base is male. The ratio is 55% men to 45% women. (Data from 2017)
- On mobile devices alone, YouTube reaches more adults aged 18 to 49 during prime time than any cable network does in an average week. (Specific definitions for 'prime time' or 'average week' are not provided in the source.)
- 75% of adults report watching YouTube on their mobile devices.
- More than 70% of YouTube watch time is generated from mobile devices.
- 96% of all teens in the United States use YouTube.
Reddit Stats
- Between 2017 and 2019 Reddit grew from 330 million monthly active users to 430 million.
- The site receives more than 21 billion monthly screen views.
- While Reddit was reportedly sold for between $10-$20 million (representing its initial acquisition), the company's valuation grew to 1.8 billion after 2017 funding rounds.
- Reddit is predominantly male. 15% of male internet users between 18 to 29 say they use Reddit. (Data from a 2013 Pew Research Center report, which is quite old and may not reflect current demographics.)
- Only 10% of female internet users under 50 say they use Reddit. (Data from a 2013 Pew Research Center report, which is quite old and may not reflect current demographics.)
What is Social9?
Understanding these social media trends and user behaviors is crucial for effective marketing. This is where platforms like Social9 come in, offering a one-stop-shop platform to drive more traffic and increase audience engagement by leveraging the power of social media.
Social9 provides free tools such as a Social sharing plugin to easily share website content, a Cloud Commenting tool to foster community discussions, a URL shortener to make links more manageable, and a Twitter post scheduler (Beta) to streamline your Twitter presence, all of which help in the growth of your website.
It offers seamless website integrations with modern web technologies, out-of-the-box analytics to track your performance, and many other "FREE" features for you to get started!