What is social media autopilot? How AI posting works (and where to keep a human)
Social media autopilot uses AI to plan, draft, schedule and publish posts. Learn how the loop works, platform AI rules, and where a human must stay in charge.
Autopilot & AI
How social media reporting APIs automate analytics: what each network exposes, no-code vs custom setups, and a step-by-step guide to a weekly automated report. Social9 TeamProduct, content and engineering team at Social9Published Updated 8 min read

A social media reporting API is the interface a network such as Instagram, LinkedIn or YouTube provides so software can pull your performance data (views, reach, engagement, follower growth, clicks) automatically. Connect your accounts once to a tool or script that calls these APIs, and your weekly report builds itself on a schedule instead of being copied by hand from six different apps. For most content creators, the fastest route is a tool that already uses the APIs; custom code is only worth it when you need data those tools do not give you.
This guide covers why manual reporting breaks down, what each network's API actually exposes, how to choose between no-code and custom setups, and a step-by-step plan for your first automated weekly report.
If you post on more than two networks, manual reporting means logging into each one, finding the right date range, copying numbers into a spreadsheet and trying to make metrics with different definitions line up. It eats a few hours every week, and it fails in predictable ways:
Automated reporting fixes all four: the data is collected the same way every time, on schedule, and you spend your time reading the report rather than assembling it.
An API (application programming interface) is a defined way for one piece of software to ask another for data. Social networks publish APIs so approved apps can, with your permission, read your account's data.

A typical automated report runs in four stages:
This is where most guides stay vague. In practice, every network offers different data under different rules, and that shapes what your report can include.
| Network | Analytics access | Typical metrics | Notes |
|---|---|---|---|
| Instagram API (Meta), professional accounts only | Views, reach, likes, comments, saves, shares, follower count | Personal accounts have no API insights. Meta has been consolidating older impression metrics into "views". | |
| Facebook Pages | Meta Graph API, Page Insights | Views, engagement, reactions, follower changes | Pages only, not personal profiles. |
| Community Management API, requires LinkedIn app approval | Impressions, clicks, reactions, comments, shares, follower stats for company Pages | Analytics for personal profiles are more limited than for Pages. | |
| YouTube | YouTube Analytics API and Reporting API | Views, watch time, average view duration, subscribers gained, traffic sources | Free to use within Google's API quotas. |
| TikTok | TikTok APIs for business and developers | Video views, likes, comments, shares, follower counts | Available metrics depend on account type and app approval. |
| Pinterest API (v5) analytics endpoints | Impressions, saves, outbound clicks, pin clicks | Business accounts get the fullest data. | |
| X | X API, paid usage tiers | Post metrics such as impressions, likes, reposts, replies | Free access is very limited; budget for API costs if you build your own. |
| Google Business Profile | Business Profile Performance API | Profile views, searches, calls, website clicks, direction requests | Reports on the profile, not individual posts. |
| Bluesky and Mastodon | Open public APIs | Likes, reposts or boosts, replies, follower counts | No impressions or reach data. |
Three practical consequences follow from this table:
An automated report can include dozens of numbers. A useful one includes a handful, grouped by the question each answers.
Falling visibility usually means a posting-frequency drop, a format the network is no longer favoring, or content that is not earning early engagement.
Saves and shares are the strongest signals that a post was useful; comments tell you what to make next.
Look at growth next to what you posted. A jump after a collaboration or a particular series is a pattern worth repeating.
This is the layer stakeholders care about. Social APIs tell you about attention; your website analytics tell you whether attention turned into results. For a fuller framework, see our social media ROI measurement guide.
There are three realistic ways to automate reporting. Most creators should start with the first two.
| Setup | How it works | Best for | Trade-offs |
|---|---|---|---|
| Social media or reporting tool | A platform connects to the network APIs and shows results in its own dashboard | Creators and small teams who want results without setup | Limited to the metrics and layouts the tool offers |
| Data connector + spreadsheet or dashboard | A connector pulls API data into Google Sheets or Looker Studio on a schedule | Teams that want custom reports without code | Connector subscription; you design the report |
| Custom scripts | Your code calls each network's API and writes to a database or sheet | Developers, agencies building their own products | App approvals, API costs (notably X) and ongoing maintenance |
When comparing options, check:
Dedicated reporting tools (such as Rival IQ), social media management suites with analytics, and developer-focused unified social APIs (such as Ayrshare) cover different points on this spectrum. Our comparison of social media reporting tools goes deeper on the trade-offs.
If what you mainly need is to see what published and how each post did, without building anything, Social9's analytics view shows results for every post it publishes across your connected networks, next to the post itself, with history from 30 days on Free up to 2 years on Enterprise. It is deliberately simple: no PDF exports or ROI attribution, just enough to decide what to post next week.
Here is a setup a solo creator or small team can finish in an afternoon.
Write one sentence: "This report helps [person] decide [decision] every [week/month]." A creator deciding what to post next week needs per-post engagement. A client deciding whether to renew needs outcomes and trends. Different audiences, different reports.
Choose one or two from each group above. A solid starting set:
?utm_source=linkedin&utm_medium=social&utm_campaign=weekly-tips.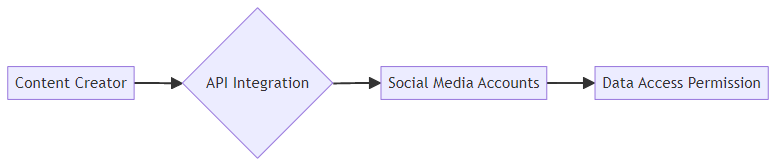
Authorize your chosen tool or connector for each network. Review the permission screen and grant analytics or read access only, unless the tool also publishes for you. Note when tokens expire; some networks require you to reconnect periodically.
Lay out the report as a single page or screen:
Set the report to refresh and send at the same time each week, such as Monday 8 AM, to the place you will actually read it. A report nobody opens is not automated reporting, it is automated noise.
Block 20 minutes after it lands. Ask three questions: What worked? What flopped? What will we change? Write the answer into next week's content plan. Our monthly social media reporting guide covers the longer monthly version of this review.
Once the basics run reliably, two additions are worth considering:
AI is most useful at the reading stage, not the collecting stage. Feed a language model your weekly metrics table and ask it to summarize what changed and suggest hypotheses ("carousel posts got twice the saves of single images this week"). Treat those as ideas to test, not conclusions: AI summaries can overstate patterns in small samples, so check the underlying numbers before changing your strategy.
Reporting APIs remove the copy-and-paste work that makes social media reporting painful, but the value comes from what you do with the report. Start with a tool or connector, track a small set of metrics that answer real questions, label each network's metrics honestly, and end every report with one decision for next week.
It is an interface a social network provides so approved software can request your account's performance data, such as views, reach, engagement and follower counts, in a structured format. Reporting tools, dashboards and custom scripts call these APIs on a schedule, which is what lets a weekly report fill itself in without anyone logging into each network and copying numbers.
No. Most creators and small teams use tools that already connect to the network APIs: social media management platforms with built-in analytics, dedicated reporting tools, or data connectors that feed Google Sheets or Looker Studio. You only need code when you want metrics or combinations those tools do not offer, or when you are building reporting into your own product.
Meta (Facebook Pages and Instagram professional accounts), LinkedIn (company Pages, with app approval), YouTube, TikTok (for business use cases), Pinterest, X (paid API tiers) and Google Business Profile all offer analytics through APIs. Bluesky and Mastodon expose public engagement counts such as likes, reposts and replies, but not impressions. Access rules and metric names change, so check each network's developer docs.
Weekly is the right rhythm for most creators and small brands: frequent enough to adjust next week's posts, slow enough that the numbers mean something. Add a monthly report for trends and stakeholders. Daily reports only make sense during launches or campaigns where you will actually change something based on one day's data.
Social media autopilot uses AI to plan, draft, schedule and publish posts. Learn how the loop works, platform AI rules, and where a human must stay in charge.

The best content repurposing tools for social media by job: video clipping, text rewriting, visuals and scheduling, plus a workflow that avoids clone posts.

Automate social media posts without sounding robotic: audit what to automate, write a voice bible for AI, add human approval and keep a kill switch ready.
Social9 schedules your posts on 11 networks, and Autopilot can draft them in your brand voice for you to approve. Start on the free plan.